|
|
| Riga 27: |
Riga 27: |
| | # TCP Bic and TCP Cubic provoke roughly three times the number of timeouts obtained by TCP Westwood+ and TCP NewReno, TCP Cubic exhibiting the worse performance. | | # TCP Bic and TCP Cubic provoke roughly three times the number of timeouts obtained by TCP Westwood+ and TCP NewReno, TCP Cubic exhibiting the worse performance. |
| | | | |
| − | * In the case of the uplink channel the algorithms exhibited similar performances, due to the fact that the moderate size of cwnd forced TCP Cubic and TCP Bic to use the linear probing in order to be TCP friendly (see [http://netsrv.csc.ncsu.edu/export/cubic_a_new_tcp_2008.pdf [1]). | + | * In the case of the uplink channel the algorithms exhibited similar performances, due to the fact that the moderate size of cwnd forced TCP Cubic and TCP Bic to use the linear probing in order to be TCP friendly (see [http://netsrv.csc.ncsu.edu/export/cubic_a_new_tcp_2008.pdf [1]]). |
| | | | |
| | | | |
Revisione 15:24, 1 Dic 2008
TCP Congestion Control Algorithms over a live HSDPA Network
We report results obtained by an extensive measurement campaign over a live HSDPA network involving more than 3000 flows resulting in around 60 hours of active measurements. The considered TCP variants are the following:
- TCP NewReno: the congestion control algorithm standardized by IETF
- TCP BIC: the default congestion control algorithm adopted by the Linux o.s.
- TCP Cubic: a congestion control algorithm designed for fast convergence employing a cubic function in the probing phase
- TCP Westwood+: available in the Linux kernel (both 2.4 and 2.6 kernels).
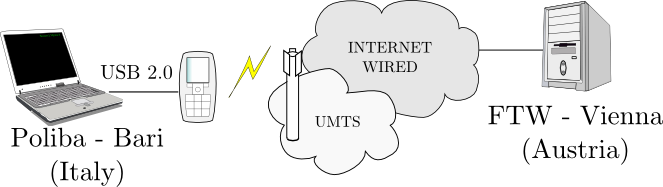
The experimental evaluation has been carried out by accessing the public Internet using a HSDPA card (see figure below).
The following instantaneous variable measurements have been collected by using the libnetmeas library:
- Goodput
- Round Trip Time (RTT)
- packet loss ratios
- number of timeouts
The main findings of the investigation can be summarized as follows:
- Differently from the case of the UMTS scenario, the considered TCP congestion control algorithms exhibited the following characteristics in the case of the downlink channel:
- The considered TCP variants perform similarly for what concerns goodput
- TCP Bic and TCP Cubic exhibit inflated values for average RTT due to the aggressive nature of their probing phase. TCP Reno and TCP Westwood+ provide lower values of RTT, TCP Westwood+ exhibiting the best performance.
- TCP Bic and TCP Cubic provoke packet retransmission values doubled with respect to the ones obtained with TCP Westwood+ and TCP NewReno.
- TCP Bic and TCP Cubic provoke roughly three times the number of timeouts obtained by TCP Westwood+ and TCP NewReno, TCP Cubic exhibiting the worse performance.
- In the case of the uplink channel the algorithms exhibited similar performances, due to the fact that the moderate size of cwnd forced TCP Cubic and TCP Bic to use the linear probing in order to be TCP friendly (see [1]).
We report cumulative distribution function plots: